- Loading...
Page History
Shenandoah GC
Shenandoah is the low pause time garbage collector that reduces GC pause times by performing more garbage collection work concurrently with the running Java program. Shenandoah does the bulk of GC work concurrently, including the concurrent compaction, which means its pause times are no longer directly proportional to the size of the heap. Garbage collecting a 200 GB heap or a 2 GB heap should have the similar low pause behavior.
Shenandoah is in upstream OpenJDK since JDK 12, under JEP 189. Backports to JDK 8u and JDK 11u are available as well, see the "Build and Run" section for more details.
| Table of Contents | ||
|---|---|---|
|
Reporting Bugs
There are several ways to report bugs. Here is the checklist:
- Try the latest nightly builds, see "Build, Run, Test" section below.
- Try narrowing down the bug using techniques from "Functional Diagnostics" and "Performance Diagnostics" sections below.
- Try to come up with the minimal test case for the issue. Larger projects are fine too, as long as developers can build and run it themselves.
- Submit the bug report, using either of these three options:
- All JDK versions: Send the message shenandoah-dev mailing list. That mailing list is moderated, so either subscribe first, or wait for moderator to accept your message.
- JDK 8, JDK 11: If you have the Red Hat subscription, and running the binaries from Fedora or RHEL, report the bug through the Red Hat support
- JDK 12 and later: Submit the OpenJDK bug report clearly mentioning which build you are running. This would require Oracle folks to accept the bug first, before handing it over to Shenandoah devs.
- Be prepared to answer a few follow-up questions
- If you have time, be prepared to test the patches and/or nightly binaries
Overview
Shenandoah is the regionalized collector, it maintains the heap as the collection of regions.
The regular Shenandoah GC cycle looks like this:

| Code Block | ||
|---|---|---|
| ||
GC(3) Pause Init Mark 0.771ms
GC(3) Concurrent marking 76480M->77212M(102400M) 633.213ms
GC(3) Pause Final Mark 1.821ms
GC(3) Concurrent cleanup 77224M->66592M(102400M) 3.112ms
GC(3) Concurrent evacuation 66592M->75640M(102400M) 405.312ms
GC(3) Pause Init Update Refs 0.084ms
GC(3) Concurrent update references  75700M->76424M(102400M) 354.341ms
GC(3) Pause Final Update Refs 0.409ms
GC(3) Concurrent cleanup 76244M->56620M(102400M) 12.242ms |
The phases above do roughly this:
Init Mark initiates the concurrent marking. It prepares the heap and application threads for concurrent mark, and then scans the root set. This is the first pause in the cycle, and the most dominant consumer is the root set scan. Therefore, its duration is dependent on the root set size.Concurrent Marking walks over the heap, and traces reachable objects. This phase runs alongside the application, and its duration is dependent on the number of live objects and the structure of object graph in the heap. Since the application is free to allocate new data during this phase, the heap occupancy goes up during concurrent marking.
Final Mark finishes the concurrent marking by draining all pending marking/update queues and re-scanning the root set. It also initializes evacuation by figuring out the regions to be evacuated (collection set), pre-evacuating some roots, and generally prepares runtime for the next phase. Part of this work can be done concurrently during Concurrent precleaning phase. This is the second pause in the cycle, and the most dominant time consumers here are draining the queues and scanning the root set.
Concurrent Cleanup reclaims immediate garbage regions – that is, the regions where no live objects are present, as detected after the concurrent mark.
Concurrent Evacuation copies the objects out of collection set to other regions. This is the major difference against other OpenJDK GCs. This phase is again running along with application, and so application is free to allocate. Its duration is dependent on the size of chosen collection set for the cycle.
Init Update Refs initializes the update references phase. It does almost nothing except making sure all GC and applications threads have finished evacuation, and then preparing GC for next phase. This is the third pause in the cycle, the shortest of them all.
Concurrent Update References walks over the heap, and updates the references to objects that were moved during concurrent evacuation. This is the major difference against other OpenJDK GCs. Its duration is dependent on number of objects in heap, but not the object graph structure, because it scans the heap linearly. This phase runs concurrently with the application.
Final Update Refs finishes the update references phase by re-updating the existing root set. It also recycles the regions from the collection set, because now heap does not have references to (stale) objects to them. This is the last pause in the cycle, and its duration is dependent on the size of root set.
Concurrent Cleanup reclaims the collection set regions, which now have no references to.
Performance Guidelines and Diagnostics
General Ideas
Heap sizes: Shenandoah performance, like the performance of almost all other GCs, depends on heap size. It should perform better in cases when there is enough heap space to accommodate allocations while concurrent phases are running (see "Failure Modes" section below). The time for concurrent phases correlates with the live data set size (LDS) -- the space taken by live data. Therefore, the reasonable heap size is dependent on LDS and allocation pressure in the workload: for a given allocation rate, larger LDS-es require proportionally larger heap sizes; for a given LDS, larger allocation rates require larger heap sizes. For some workloads with minuscule live data sets and moderate allocation pressure, 1...2 GB heaps performs well. We routinely test on 4...128 GB heaps on various workloads with up to 80% LDS size. Don't be shy to try different heap sizes to see what fits your workload.
Pauses: Shenandoah's pause behavior is largely dominated by root set operations: scanning and updating the roots. Root set includes: local variables, references embedded in generated code, interned Strings, references from classloaders (e.g. static final references), JNI references, JVMTI references. Having larger root set generally means longer pauses with Shenandoah, unless concrete JDK version has the capabilities for doing parts of that work concurrently and Shenandoah is able to use it. Second-order effects are: a) weak reference processing (which happens in Final Mark pause), but only for those references that need processing; and b) class unloading and other JDK cleanups (which also happens in Final Mark pause). These second-order effects can be mitigated by configuring additional options that control processing frequency (including disabling it altogether) and/or modifying the applications to play a bit nicer.
Throughput: Since Shenandoah is concurrent GC, it employs barriers to maintain invariants during the collection cycle. Those barriers might induce the measurable throughput loss. See the diagnostic section below for the ways to dissect what is happening there. Some users report that the throughput loss due to barriers is paid off with naturally offloading concurrent GC work to spare and otherwise idle cores; in other words, in some cases it trades higher application+JVM utilization for higher application throughput.
In most cases, the pause times are within 0..10ms and throughput losses are within 0..15%. The actual performance numbers depend heavily on the actual application, load profile, etc. With applications that do not have a lot of roots, weak reference and/or class churn, the pauses can be in sub-millisecond range. With applications that do not mutate heap as much, or are well optimized by current compilers, the barrier overhead can be near zero. The rest of the section describes the approaches to test and diagnose performance behaviors with Shenandoah. If you suspect something is off on your concrete use case, consider letting developers know about them. Chances are, that is a manageable issue or a straight-away bug.
Basic configuration
Basic configuration and command line options:
-Xlog:gc (since JDK 9) or -verbose:gc (up to JDK 8) would print the individual GC timings.-Xlog:gc+ergo (since JDK 9) or -XX:+PrintGCDetails (up to JDK 8) or would print the heuristics decisions, which might shed light on outliers, if any.
It is almost always a good idea to run with logging enabled. This summary table conveys important information about GC performance, and we would almost inevitably ask for one in a performance bug report. Heuristics logs are useful to figure out GC outliers.
Other recommended JVM options are:
-XX:+AlwaysPreTouch: committing heap pages into memory helps to reduce latency hiccups-Xms and -Xmx: making the heap non-resizeable with -Xms = -Xmx reduces hiccups with heap management. Coupled with AlwaysPreTouch, the -Xms = -Xmx would commit all memory on startup, which avoids hiccups when memory is finally used. -Xms also defines the low boundary for memory uncommit, so with -Xms = -Xmx all memory would stay committed. That said, if you want to configure Shenandoah for lower footprint, then setting lower -Xms is recommended. You need to decide how low to set it to balance the commit/uncommit overhead vs memory footprint. In many cases, setting -Xms arbitrarily low would be fine.
-XX:+UseTransparentHugePages: this greatly improves performance on large heaps. It is recommended to set /sys/kernel/mm/transparent_hugepage/enabled and /sys/kernel/mm/transparent_hugepage/defrag to "madvise" on Linux. When running with AlwaysPreTouch, then init/shutdown would be faster, because it will pretouch with larger pages. It will also pay the defrag costs upfront at startup
Support Overview
OS Support
Shenandoah does not have any special needs from the OS, but the build might require fiddling with code.
Supported | Comment | |
|---|---|---|
Linux |
| Primary target; continuously tested. |
Windows |
| Secondary target; continuously tested. |
macOS |
| Additional target; tested by community. |
Solaris |
| Additional target; tested by community. |
Others |
| The porting should be trivial, please try and contact Shenandoah devs with your success and failure reports. |
Hardware Support
Shenandoah does need to implement some hardware-specific bits. Porting requires some assembly-level coding.
Supported | Comment | |
|---|---|---|
x86_64 |
| Primary target; continuously tested. |
x86_32 |
| Secondary target; continuously tested. |
AArch64 |
| Primary target; continuously tested. |
PPC64 |
| Secondary target; community tested. |
| RISCV64 | Secondary target; community tested, part of riscv-port | |
ARM32 |
| In (slow) development; help welcome. |
S390X |
| Not supported; contributions welcome. |
SPARC |
| Not supported. No hardware to test on. |
Others |
| Please contact Shenandoah devs for guidance if you are willing to port Shenandoah to another platform. |
JDK Support
Shenandoah is in upstream OpenJDK 12+ (JEP 189), and later contributed to upstream OpenJDK 11u. Downstream backport to OpenJDK 8u is available as well. Shenandoah follows the "express" development model, where the features and bugfixes are continuously backported to previous supported JDK releases. Critical bugfixes are backported first, and are released as soon as possible. Non-critical bugfixes and features may appear in backports a bit later. The improvements in shared GC and runtime code might not be easily backportable, although some of them are backported as part of OpenJDK Updates project. Major GC improvements might ship even later.
| Supported | Ready for Production | Role | Comment | |
|---|---|---|---|---|
JDK 8 |
| Stable LTS | Available as non-mainline 8u backport. Check with your vendor for availability. See known vendors list below. | |
JDK 9 |
| Discontinued, migrate to 11/17 as soon as possible. | ||
JDK 10 |
| Discontinued, migrate to 11/17 as soon as possible. | ||
JDK 11 |
| Stable LTS | In mainline OpenJDK 11u since 11.0.9. Requires opt-in during build time, check with your vendor for availability. See known vendors list below. | |
JDK 12 |
| Discontinued, migrate to 17 as soon as possible. | ||
JDK 13 |
| Discontinued, migrate to 17 | ||
JDK 14 |
| Discontinued, migrate to 17. | ||
JDK 15 |
| Discontinued, migrate to 17. | ||
| JDK 16 | Discontinued, migrate to 17. | |||
| JDK 17 | Stable LTS | In mainline OpenJDK builds. | ||
| JDK 18 | Dev/Test | In mainline OpenJDK builds. |
This means you don't have to select the very latest JDK release to have most of the fixes and conveniences, but later releases might be more up-to-date.
If you want to understand the gory details how the changes flow between the development repos and builds, look at this diagram.
Releases
Shenandoah availability differs by vendor and JDK release. OpenJDK 12+ builds normally include Shenandoah by default. OpenJDK 11 requires the opt-in during build time.
Known vendor status is:
- Red Hat
Fedora 24+ OpenJDK 8+ builds include Shenandoah
- RHEL 7.4+ ships with OpenJDK 8+ that includes Shenandoah as Technology Preview
- Red Hat OpenJDK 8u builds for Windows include Shenandoah
- Amazon
- Ships Shenandoah in Amazon Corretto, starting with OpenJDK 11.0.9
- Oracle
- Does not ship Shenandoah in any release, both OpenJDK builds and proprietary builds
- Azul
- Ships Shenandoah in Azul Zulu, starting with OpenJDK 11.0.9
- SAP
- Shenandoah is shipped and supported starting with SapMachine 17
- AdoptOpenJDK
- Ships Shenandoah in default binaries, starting with OpenJDK 11.0.9
- Linux distributions
- Debian ships Shenandoah starting with OpenJDK 11.0.9
- Gentoo ebuilds for IcedTea have Shenandoah USE flag
- RHEL/Fedora-based distros or other distros that use packages from them may also have Shenandoah enabled. Notably, CentOS, Oracle Linux, and Amazon Linux are known to ship it.
Nightly Builds
There are (nightly/weekly) development builds available at these locations:
- Linux nightly builds are available at builds.shipilev.net
Linux/x86_64 nightly builds are also available as Docker images, e.g.:
Code Block language bash # Update the image to the most recent one: $ docker pull shipilev/openjdk $ docker pull shipilev/openjdk:17 $ docker pull shipilev/openjdk:11 # Run the latest version: $ docker run --rm -it shipilev/openjdk java -XX:+UseShenandoahGC -Xlog:gc -version [0.007s][info][gc] Using Shenandoah ... # Run the JDK 17 version: $ docker run --rm -it shipilev/openjdk:17 java -XX:+UseShenandoahGC -Xlog:gc -version [0.007s][info][gc] Using Shenandoah ... # Run the JDK 11 version: $ docker run --rm -it shipilev/openjdk:11 java -XX:+UseShenandoahGC -Xlog:gc -version [0.008s][info][gc] Using Shenandoah ...
Reporting Bugs
There are several ways to report bugs. Here is the checklist:
- Try the latest nightly builds, see the section above.
- Try narrowing down the bug using techniques from "Functional Diagnostics" and "Performance Diagnostics" sections below.
- Try to come up with the minimal test case for the issue. Larger projects are fine too, as long as developers can build and run it themselves.
- Submit the bug report, using either of these three options:
- All JDK versions: Send the message shenandoah-dev mailing list. That mailing list is moderated, so either subscribe first, or wait for moderator to accept your message.
- JDK 8, JDK 11: If you have the Red Hat subscription, and running the binaries from Fedora or RHEL, report the bug through the Red Hat support
- JDK 12 and later: Submit the OpenJDK bug report clearly mentioning which build you are running. This would require Oracle folks to accept the bug first, before handing it over to Shenandoah devs.
- Be prepared to answer a few follow-up questions
- If you have time, be prepared to test the patches and/or nightly binaries
Implementation Overview
Shenandoah is the regionalized collector, it maintains the heap as the collection of regions.
The regular Shenandoah GC cycle looks like this:
| Code Block | ||
|---|---|---|
| ||
GC(3) Pause Init Mark 0.771ms
GC(3) Concurrent marking 76480M->77212M(102400M) 633.213ms
GC(3) Pause Final Mark 1.821ms
GC(3) Concurrent cleanup 77224M->66592M(102400M) 3.112ms
GC(3) Concurrent evacuation 66592M->75640M(102400M) 405.312ms
GC(3) Pause Init Update Refs 0.084ms
GC(3) Concurrent update references  75700M->76424M(102400M) 354.341ms
GC(3) Pause Final Update Refs 0.409ms
GC(3) Concurrent cleanup 76244M->56620M(102400M) 12.242ms |
The phases above do roughly this:
- Init Mark initiates the concurrent marking. It prepares the heap and application threads for concurrent mark, and then scans the root set. This is the first pause in the cycle, and the most dominant consumer is the root set scan. Therefore, its duration is dependent on the root set size.
- Concurrent Marking walks over the heap, and traces reachable objects. This phase runs alongside the application, and its duration is dependent on the number of live objects and the structure of object graph in the heap. Since the application is free to allocate new data during this phase, the heap occupancy goes up during concurrent marking.
- Final Mark finishes the concurrent marking by draining all pending marking/update queues and re-scanning the root set. It also initializes evacuation by figuring out the regions to be evacuated (collection set), pre-evacuating some roots, and generally prepares runtime for the next phase. Part of this work can be done concurrently during Concurrent precleaning phase. This is the second pause in the cycle, and the most dominant time consumers here are draining the queues and scanning the root set.
- Concurrent Cleanup reclaims immediate garbage regions – that is, the regions where no live objects are present, as detected after the concurrent mark.
- Concurrent Evacuation copies the objects out of collection set to other regions. This is the major difference against other OpenJDK GCs. This phase is again running along with application, and so application is free to allocate. Its duration is dependent on the size of chosen collection set for the cycle.
- Init Update Refs initializes the update references phase. It does almost nothing except making sure all GC and applications threads have finished evacuation, and then preparing GC for next phase. This is the third pause in the cycle, the shortest of them all.
- Concurrent Update References walks over the heap, and updates the references to objects that were moved during concurrent evacuation. This is the major difference against other OpenJDK GCs. Its duration is dependent on number of objects in heap, but not the object graph structure, because it scans the heap linearly. This phase runs concurrently with the application.
- Final Update Refs finishes the update references phase by re-updating the existing root set. It also recycles the regions from the collection set, because now heap does not have references to (stale) objects to them. This is the last pause in the cycle, and its duration is dependent on the size of root set.
- Concurrent Cleanup reclaims the collection set regions, which now have no references to.
Performance Guidelines and Diagnostics
General Ideas
Heap sizes: Shenandoah performance, like the performance of almost all other GCs, depends on heap size. It should perform better in cases when there is enough heap space to accommodate allocations while concurrent phases are running (see "Failure Modes" section below). The time for concurrent phases correlates with the live data set size (LDS) -- the space taken by live data. Therefore, the reasonable heap size is dependent on LDS and allocation pressure in the workload: for a given allocation rate, larger LDS-es require proportionally larger heap sizes; for a given LDS, larger allocation rates require larger heap sizes. For some workloads with minuscule live data sets and moderate allocation pressure, 1...2 GB heaps performs well. We routinely test on 4...128 GB heaps on various workloads with up to 80% LDS size. Don't be shy to try different heap sizes to see what fits your workload.
Pauses: Shenandoah's pause behavior is largely dominated by root set operations: scanning and updating the roots. Root set includes: local variables, references embedded in generated code, interned Strings, references from classloaders (e.g. static final references), JNI references, JVMTI references. Having larger root set generally means longer pauses with Shenandoah, unless concrete JDK version has the capabilities for doing parts of that work concurrently and Shenandoah is able to use it. Second-order effects are: a) weak reference processing (which happens in Final Mark pause), but only for those references that need processing; and b) class unloading and other JDK cleanups (which also happens in Final Mark pause). These second-order effects can be mitigated by configuring additional options that control processing frequency (including disabling it altogether) and/or modifying the applications to play a bit nicer.
Throughput: Since Shenandoah is concurrent GC, it employs barriers to maintain invariants during the collection cycle. Those barriers might induce the measurable throughput loss. See the diagnostic section below for the ways to dissect what is happening there. Some users report that the throughput loss due to barriers is paid off with naturally offloading concurrent GC work to spare and otherwise idle cores; in other words, in some cases it trades higher application+JVM utilization for higher application throughput.
In most cases, the pause times are within 0..10ms and throughput losses are within 0..15%. The actual performance numbers depend heavily on the actual application, load profile, etc. With applications that do not have a lot of roots, weak reference and/or class churn, the pauses can be in sub-millisecond range. With applications that do not mutate heap as much, or are well optimized by current compilers, the barrier overhead can be near zero. The rest of the section describes the approaches to test and diagnose performance behaviors with Shenandoah. If you suspect something is off on your concrete use case, consider letting developers know about them. Chances are, that is a manageable issue or a straight-away bug.
Basic configuration
Basic configuration and command line options:
- -Xlog:gc (since JDK 9) or -verbose:gc (up to JDK 8) would print the individual GC timings.
- -Xlog:gc+ergo (since JDK 9) or -XX:+PrintGCDetails (up to JDK 8) or would print the heuristics decisions, which might shed light on outliers, if any.
- -Xlog:gc+stats (since JDK 9) or -verbose:gc (up to JDK 8) would print the summary table on Shenandoah internal timings at the end of the run.
It is almost always a good idea to run with logging enabled. This summary table conveys important information about GC performance, and we would almost inevitably ask for one in a performance bug report. Heuristics logs are useful to figure out GC outliers.
Other recommended JVM options are:
- -XX:+AlwaysPreTouch: committing heap pages into memory helps to reduce latency hiccups
- -Xms and -Xmx: making the heap non-resizeable with -Xms = -Xmx reduces hiccups with heap management. Coupled with AlwaysPreTouch, the -Xms = -Xmx would commit all memory on startup, which avoids hiccups when memory is finally used. -Xms also defines the low boundary for memory uncommit, so with -Xms = -Xmx all memory would stay committed. That said, if you want to configure Shenandoah for lower footprint, then setting lower -Xms is recommended. You need to decide how low to set it to balance the commit/uncommit overhead vs memory footprint. In many cases, setting -Xms arbitrarily low would be fine.
- Using large pages greatly improves performance on large heaps. There are two ways to opt-in. -XX:+UseLargePages would enable hugetlbfs (Linux) or Windows (with appropriate privileges) support. -XX:+UseTransparentHugePages would enable it transparently. With transparent huge pages, it is recommended to set /sys/kernel/mm/transparent_hugepage/enabled and /sys/kernel/mm/transparent_hugepage/defrag to "madvise". When running with AlwaysPreTouch, it will also pay the defrag costs upfront at startup.
- -XX:+UseNUMA: while Shenandoah does not support NUMA explicitly yet, it is a good idea to enable this to enable NUMA interleaving on multi-socket hosts. Coupled with AlwaysPreTouch, it provides better performance than the default out-of-the-box configuration
- -XX:-UseBiasedLocking: there is a tradeoff between uncontended (biased) locking throughput, and the safepoints JVM does to enable and disable them as needed. For latency-oriented workloads, it makes sense to turn biased locking off.
- -XX:+DisableExplicitGC: invoking System.gc() from user code forces Shenandoah to perform additional GC cycle; it might be profitable to disable this to protect from the code that abuses System.gc(). It usually does not hurt, as -XX:+ExplicitGCInvokesConcurrent gets enabled by default, which means the concurrent GC cycle would be invoked, not the STW Full GC.
Modes
Modes define the major way Shenandoah runs. This defines what barriers, if any, Shenandoah is using, and defines the major performance characteristics. Mode can be selected with -XX:ShenandoahGCMode=<name>. Available modes are:
- normal/satb (product, default). This mode runs concurrent GC with Snapshot-At-The-Beginning (SATB) marking. This marking mode is similar to what G1 is doing: intercepts writes and marks through "previous" objects.
- iu (experimental). This mode runs concurrent GC with Incremental Update (IU) marking. This marking mode does the mirror of SATB mode: intercepts writes and marks through "new" objects. This may make marking less conservative, especially around accessing weak references.
- passive (diagnostic). This mode runs stop-the-world GCs. This mode is used for functional testing, but sometimes it is useful for bisecting performance anomalies with GC barriers (see below), or figuring out the actual live data size in the application.
Heuristics
After mode is selected, heuristics tell when Shenandoah starts the GC cycle, and regions it deems for evacuation. Heuristics can be selected with -XX:ShenandoahGCHeuristics=<name>. Some heuristics accept configuration parameters, which might help to tailor the GC operation to your use case better. Available heuristics include:
- adaptive (default). This heuristics observes the previous GC cycles, and tries to start the next GC cycle so that it could complete before heap is exhausted
-XX:ShenandoahInitFreeThreshold=#: Initial threshold at which to trigger "learning" collections
-XX:ShenandoahMinFreeThreshold=#: free space threshold at which heuristics triggers the GC unconditionally
-XX:ShenandoahAllocSpikeFactor=#: How much heap to reserve for absorbing allocation spikes
-XX:ShenandoahGarbageThreshold=#: Sets the percentage of garbage a region need to contain before it can be marked for collection.
- static (previously and ironically known as dynamic). This heuristics decide to start GC cycle based on heap occupancy. Useful tuning knobs for this heuristics are:
-XX:ShenandoahMinFreeThreshold=#: Set the percentage of free heap at which a GC cycle is started
-XX:ShenandoahGarbageThreshold=#: Sets the percentage of garbage a region need to contain before it can be marked for collection
compact (previously erroneously known as continuous). This heuristics runs GC cycles continuously, starting the next cycle as soon as previous cycle finishes, as long as allocations happen. This heuristics would normally incur throughput overheads, but shall provide the most prompt space reclamation. Useful tuning knobs are:
-XX:ConcGCThreads=#: Trim down the number of concurrent GC threads to make more room for application to run
-XX:ShenandoahAllocationThreshold=#: Set percentage of memory allocated since last GC cycle before starting another one
- aggressive (diagnostic). This heuristics tells GC to be completely active. It will start the new GC cycle as soon as the previous one finishes (like "compact"), and it will evacuate all live objects. This heuristics is useful for functional testing of the collector itself. It incurs heavy performance penalty.
Failure Modes
Concurrent GC like Shenandoah implicitly relies on collecting faster than application allocates. If allocation pressure is high, and there is not enough space to absorb the allocations while GC is running, Allocation Failure would eventually happen. Shenandoah has a graceful degradation ladder that helps to survive the cases like these. The ladder consists of:
- Pacing (-XX:+ShenandoahPacing, enabled by default). When GC is running, it has the idea how much GC work is needed to be done, and how much free space is available for application. Pacer would try to stall allocating threads when the GC progress is not fast enough. In normal conditions, GC collects faster than application allocates, and pacer naturally does not stall. Note that pacing introduces the local per-thread latency that is not visible in usual profiling tools. This is why the stalls are not indefinite, and they are bounded by -XX:ShenandoahPacingMaxDelay=#ms. After max delay expires, the allocation would happen anyway. Most of the time, mild allocation spikes are absorbed by the pacer. When allocation pressure is very high, pacer would not be able to cope, and the degradation moves to the next step.
Usual latency induced: <10 ms - Degenerated GC (-XX:+ShenandoahDegeneratedGC, enabled by default). If application runs into allocation failure, then Shenandoah would dive into stop-the-world pause, stop the entire application, and continue the cycle under the pause. Degenerated GC continues the in-progress "concurrent" cycle under stop-the-world. In many cases, allocation failure happens after a significant amount of GC work is already done, and a small part of GC work needs to be completed. This is why the STW pause is not usually large. It would be reported as GC pause in the GC log, all the usual monitoring and heartbeat threads: indeed, one of the reasons to induce STW pause is to make concurrent mode failures clearly observable. Degenerated GC may happen if GC cycle started too late, or if a very significant allocation spike had occurred. The Degenerated cycle might be faster than the concurrent one, because it does not contend with the application over the resources, and it uses -XX:ParallelGCThreads, not -XX:ConcGCThreads for thread pool sizing.
Usual latency induced: <100 ms, but can be more, depending on the degeneration point - Full GC. If nothing helped, for example, when Degenerated GC had not freed up enough memory, Full GC cycle would happen, and compact the heap to the max. Certain scenarios, like the unusually fragmented heap coupled with implementation performance bugs and overlooks, would be fixed only by Full GC. This last-ditch GC guarantees that application would not fail with OOM, if there is at least some memory is available.
Usual latency induced: >100 ms, but can be more, especially on a very occupied heap
In addition to usual GC log that would print individual Degenerated GC and Full GC events, -Xlog:gc+stats would show something like this at the end of the run:
| Code Block | ||
|---|---|---|
| ||
Under allocation pressure, concurrent cycles may cancel, and either continue cycle
under stop-the-world pause or result in stop-the-world Full GC. Increase heap size,
tune GC heuristics, set more aggressive pacing delay, or lower allocation rate
to avoid Degenerated and Full GC cycles.

 4912 successful concurrent GCs
      0 invoked explicitly

    3 Degenerated GCs
      3 caused by allocation failure
         3 happened at Update Refs
      0 upgraded to Full GC

    0 Full GCs
      0 invoked explicitly
      0 caused by allocation failure
      0 upgraded from Degenerated GC

ALLOCATION PACING:

Max pacing delay is set for 10 ms.

Higher delay would prevent application outpacing the GC, but it will hide the GC latencies
from the STW pause times. Pacing affects the individual threads, and so it would also be
invisible to the usual profiling tools, but would add up to end-to-end application latency.
Raise max pacing delay with care.

Actual pacing delays histogram:
      From -         To        Count
      1 ms -       2 ms:          87
      2 ms -       4 ms:         142
      4 ms -       8 ms:         297
      8 ms -      16 ms:        1733
     16 ms -      32 ms:          21
32 ms - 64 ms: 1 |
From this, there are a few things to try if application runs into either of these degradation steps:
- Give the application more heap. This would allow to absorb more allocations when GC is running.
- Trim down the amount of live data in the heap. This would allow GC cycle to run faster, and cope with allocations better.
- Trim down the allocation pressure. For example, reduce the number of allocating threads, or fix the major allocation hogs in the application.
- Tune up heuristics to start the GC cycle as soon as possible. It might not help if GC logs already say that GC is running back-to-back cycles.
- Crank up the pacing delay. This would stall allocating threads more, instead of elevating to Degenerated and Full GCs – note this still introduce latency for those allocating threads!
Performance Analysis
Approaches to performance analysis:
- Some odd performance behaviors – like the allocation failure GCs, or long final marks – can be explained by heuristics issues. -Xlog:gc+ergo is your friend there. If you have a long-running workload, running under Shenandoah Visualizer would let you understand the high-level GC behavior. Sometimes the odd behavior is clearly visible there.
- Some performance difference can be explained by larger allocation pressure under Shenandoah, since it includes the forwarding pointer with each object. Look at the allocation rates to see if that might be a problem, and do experiments that could confirm this (for example, beefing up objects should diminish the performance difference against another collector). There are some cases when larger footprint means dropping out of CPU cache, look for L1/L2/LLC miss differences.
Many throughput differences can be explained by GC barriers overhead. When running with -XX:ShenandoahGCHeuristics=passive, and that heuristics only, barriers are not required for correctness, and so heuristics disables them. It is then possible to enable the barriers selectively back, and see what barriers are affecting throughput performance. The list of barriers that "passive" heuristics is disabling is listed in GC output, like this:
Code Block language bash $ java -XX:+UseShenandoahGC -XX:ShenandoahGCHeuristics=passive -Xlog:gc [0.002s][info][gc] Passive heuristics implies -XX:-ShenandoahSATBBarrier by default [0.002s][info][gc] Passive heuristics implies -XX:-ShenandoahKeepAliveBarrier by default [0.002s][info][gc] Passive heuristics implies -XX:-ShenandoahWriteBarrier by default [0.002s][info][gc] Passive heuristics implies -XX:-ShenandoahReadBarrier by default [0.002s][info][gc] Passive heuristics implies -XX:-ShenandoahStoreValReadBarrier by default [0.002s][info][gc] Passive heuristics implies -XX:-ShenandoahCASBarrier by default [0.002s][info][gc] Passive heuristics implies -XX:-ShenandoahAcmpBarrier by default [0.002s][info][gc] Passive heuristics implies -XX:-ShenandoahCloneBarrier by default [0.003s][info][gc] Using Shenandoah- Profiling the native GC code is easy with Linux perf:
- Build OpenJDK with
--with-native-debug-symbols=internal, this will get you the mapping to C++ code - Run the workload with
perf record java ...(plain profile) orperf record -g java ...(call tree profile) - Open the report with
perf report - Navigate the report, and see where are suspiciously hot methods/paths are. Pressing
"a"on the method usually gives a more detailed disassembly for it
- Build OpenJDK with
- Profiling the barriers code requires PrintAssembly-enabled build. We recommend to use JMH -prof perfasm to create the isolated scenarios and looking at the generated code under Shenandoah.
It is important to understand that GC pauses might not be the only significant contributor to response times in regular applications. Having large GC pause spells the problem with response time with a very high probability, but the absence of long GC pauses does not always mean decent response time. Queueing delays, network latencies, other services latencies, OS scheduler jitter, etc. could be the contributing cost. Running Shenandoah with response time measurement is recommended to get the full picture of what is going on in the system, which can then be used to correlate with GC pause time statistics.
For example, this is a sample report with jHiccup on one of the workloads:
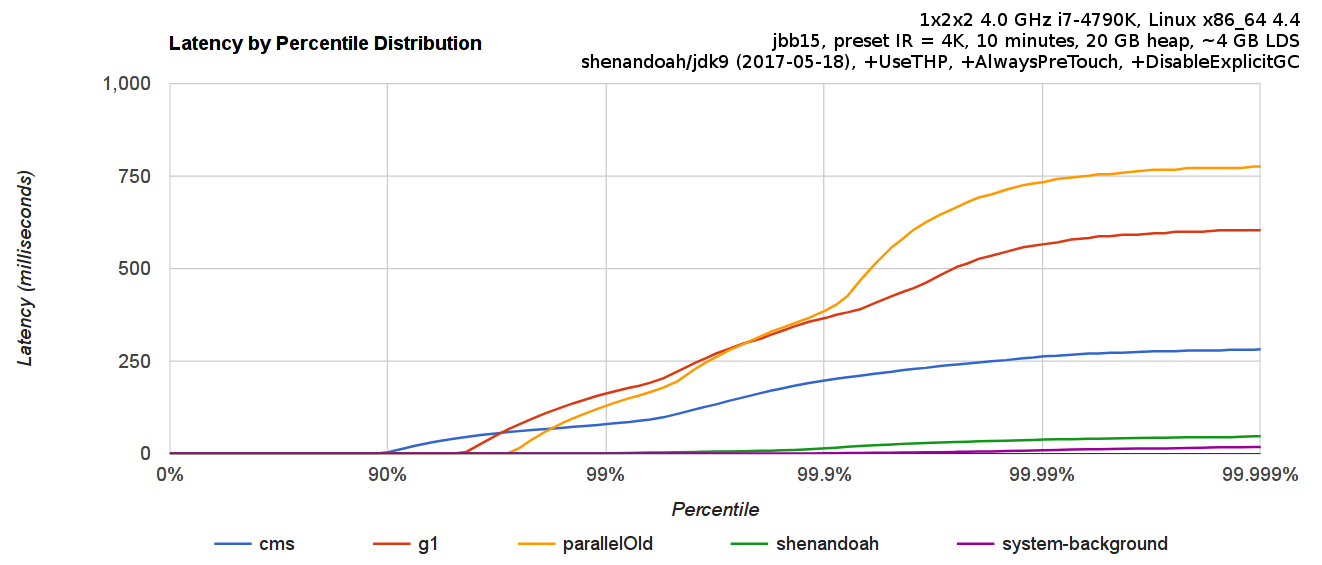
Functional Diagnostics
This section describes the ways one can diagnose and/or debug Shenandoah.
These are the steps you can do to narrow the problem area:
- Run with -XX:+ShenandoahVerify. This is the first line of defense against GC bugs. It is available in both release and fastdebug builds. If Verifier identifies a problem, then it is most likely the GC bug. A simple reproducer would be convenient to have in order to diagnose this better. In many cases, what happened before in the GC matters, e.g. the last actions taken by GC. That history is usually recorded in associated hs_err_pidXXXX.log, be sure to include it in full while reporting the bug.
- Run with fastdebug build. In many cases, this will produce the meaningful assert messages, pointing at the earliest moment when GC detected the functional anomaly, and Shenandoah asserts a lot. These builds can be produced by adding --enable-debug to configure, and re-building. As usual, hs_err_pidXXXX.log conveniently records the environment and historical data that helps to investigate the assertion failure.
- Run with -XX:ShenandoahGCHeuristics=passive, which will do the stop-the-world GCs only, and avoid doing most of concurrent work. If the issue goes away in passive mode, it must be the bug in concurrent phases and/or barriers.
- Run with different compilers: -Xint (interpreter only), -XX:TieredStopAtLevel=1 (C1 only), -XX:-TieredCompilation (interpreter and C2 only) – to dissect which modes fail, and which are not. This would highlight if the issue is in barriers handling or optimizations in interpreter, C1, or C2. This is usually helpful to combine with fastdebug builds, because compilers assert things too.
- Run with -XX:ShenandoahGCHeuristics=aggressive. This heuristics runs back-to-back GCs, and evacuates all non-empty regions. Since Shenandoah does most GC heavy-lifting concurrently, this does not block application from executing, although GC would consume much more cycles in this mode and slow the application down. Note that enabling Verifier in this mode would probably degrade performance to unpractical levels.
- Add more verifications with -XX:+ShenandoahVerifyOptoBarriers (verifies barriers in C2's ideal graph), -XX:VerifyStrictOopOperations (performs additional checks to verify that oop comparisons are done correctly).
General debugging techniques apply to Shenandoah:
- Put logging statements in the code around the failing assert to understand the issue better. With enough logging, you can retrace everything that happened in the collector.
- Add more asserts around the suspicious parts in the code. Look at macro definitions in shenandoahAsserts.hpp to see what rich asserts are available
- Attach a native debugger, for example, gdb, by asking VM to do the external action on failure with -XX:OnError="gdb - %p" (%p would get substituted with process PID)
- Create a simple reproducer and hand it over to Shenandoah developers. :)
-XX:-UseBiasedLocking: there is a tradeoff between uncontended (biased) locking throughput, and the safepoints JVM does to enable and disable them as needed. For latency-oriented workloads, it makes sense to turn biased locking off.
Heuristics
Heuristics tell when Shenandoah starts the GC cycle, and regions it deems for evacuation. Heuristics can be selected with -XX:ShenandoahGCHeuristics=<name>. Some heuristics accept configuration parameters, which might help to tailor the GC operation to your use case better. Available heuristics include:
adaptive (default). This heuristics observes the previous GC cycles, and tries to start the next GC cycle so that it could complete before heap is exhausted-XX:ShenandoahInitFreeThreshold=#: Initial threshold at which to trigger "learning" collections
-XX:ShenandoahMinFreeThreshold=#: free space threshold at which heuristics triggers the GC unconditionally
-XX:ShenandoahAllocSpikeFactor=#: How much heap to reserve for absorbing allocation spikes
static (previously and ironically known as dynamic). This heuristics decide to start GC cycle based on heap occupancy and allocation pressure. Useful tuning knobs for this heuristics are:
-XX:ShenandoahFreeThreshold=#: Set the percentage of free heap at which a GC cycle is started
-XX:ShenandoahAllocationThreshold=#: Set percentage of memory allocated since last GC cycle before a new GC cycle is started
compact (previously erroneously known as continuous). This heuristics runs GC cycles continuously, starting the next cycle as soon as previous cycle finishes, as long as allocations happen. This heuristics would normally incur throughput overheads, but shall provide the most prompt space reclamation. Useful tuning knobs are:
-XX:ConcGCThreads=#: Trim down the number of concurrent GC threads to make more room for application to run
passive (diagnostic). This heuristics tells GC to be completely passive. Once available memory runs out, Full Stop-The-World GC would be triggered. This heuristics is used for functional testing, but sometimes it is useful for bisecting performance anomalies with GC barriers (see below), or figuring out the actual live data size in the application.
aggressive (diagnostic). This heuristics tells GC to be completely active. It will start the new GC cycle as soon as the previous one finishes (like "compact"), and it will evacuate all live objects. This heuristics is useful for functional testing of the collector itself. It incurs heavy performance penalty.
In some cycles, Update References phase is merged with Concurrent Marking phase, at heuristics discretion. You can forcefully enable/disable Update References with -XX:ShenandoahUpdateRefsEarly=[on|off].
Failure Modes
Concurrent GC like Shenandoah implicitly relies on collecting faster than application allocates. If allocation pressure is high, and there is not enough space to absorb the allocations while GC is running, Allocation Failure would eventually happen. Shenandoah has a graceful degradation ladder that helps to survive the cases like these. The ladder consists of:
Pacing (-XX:+ShenandoahPacing, enabled by default). When GC is running, it has the idea how much GC work is needed to be done, and how much free space is available for application. Pacer would try to stall allocating threads when the GC progress is not fast enough. In normal conditions, GC collects faster than application allocates, and pacer naturally does not stall. Note that pacing introduces the local per-thread latency that is not visible in usual profiling tools. This is why the stalls are not indefinite, and they are bounded by -XX:ShenandoahPacingMaxDelay=#ms. After max delay expires, the allocation would happen anyway. Most of the time, mild allocation spikes are absorbed by the pacer. When allocation pressure is very high, pacer would not be able to cope, and the degradation moves to the next step.Usual latency induced: <10 ms
Degenerated GC (-XX:+ShenandoahDegeneratedGC, enabled by default). If application runs into allocation failure, then Shenandoah would dive into stop-the-world pause, stop the entire application, and continue the cycle under the pause. Degenerated GC continues the in-progress "concurrent" cycle under stop-the-world. In many cases, allocation failure happens after a significant amount of GC work is already done, and a small part of GC work needs to be completed. This is why the STW pause is not usually large. It would be reported as GC pause in the GC log, all the usual monitoring and heartbeat threads: indeed, one of the reasons to induce STW pause is to make concurrent mode failures clearly observable. Degenerated GC may happen if GC cycle started too late, or if a very significant allocation spike had occurred. The Degenerated cycle might be faster than the concurrent one, because it does not contend with the application over the resources, and it uses -XX:ParallelGCThreads, not -XX:ConcGCThreads for thread pool sizing.
Usual latency induced: <100 ms, but can be more, depending on the degeneration point
Usual latency induced: >100 ms, but can be more, especially on a very occupied heap
In addition to usual GC log that would print individual Degenerated GC and Full GC events, -Xlog:gc+stats would show something like this at the end of the run:
| Code Block | ||
|---|---|---|
| ||
Under allocation pressure, concurrent cycles may cancel, and either continue cycle
under stop-the-world pause or result in stop-the-world Full GC. Increase heap size,
tune GC heuristics, set more aggressive pacing delay, or lower allocation rate
to avoid Degenerated and Full GC cycles.
4912 successful concurrent GCs
0 invoked explicitly
3 Degenerated GCs
3 caused by allocation failure
3 happened at Update Refs
0 upgraded to Full GC
0 Full GCs
0 invoked explicitly
0 caused by allocation failure
0 upgraded from Degenerated GC
ALLOCATION PACING:
Max pacing delay is set for 10 ms.
Higher delay would prevent application outpacing the GC, but it will hide the GC latencies
from the STW pause times. Pacing affects the individual threads, and so it would also be
invisible to the usual profiling tools, but would add up to end-to-end application latency.
Raise max pacing delay with care.
Actual pacing delays histogram:
From - To Count
1 ms - 2 ms: 87
2 ms - 4 ms: 142
4 ms - 8 ms: 297
8 ms - 16 ms: 1733
16 ms - 32 ms: 21
32 ms - 64 ms: 1 |
From this, there are a few things to try if application runs into either of these degradation steps:
- Give the application more heap. This would allow to absorb more allocations when GC is running.
- Trim down the amount of live data in the heap. This would allow GC cycle to run faster, and cope with allocations better.
- Trim down the allocation pressure. For example, reduce the number of allocating threads, or fix the major allocation hogs in the application.
- Tune up heuristics to start the GC cycle as soon as possible. It might not help if GC logs already say that GC is running back-to-back cycles.
- Crank up the pacing delay. This would stall allocating threads more, instead of elevating to Degenerated and Full GCs – note this still introduce latency for those allocating threads!
Performance Analysis
Approaches to performance analysis:
Some odd performance behaviors – like the allocation failure GCs, or long final marks – can be explained by heuristics issues. -Xlog:gc+ergo is your friend there. If you have a long-running workload, running under Shenandoah Visualizer would let you understand the high-level GC behavior. Sometimes the odd behavior is clearly visible there.Some performance difference can be explained by larger allocation pressure under Shenandoah, since it includes the forwarding pointer with each object. Look at the allocation rates to see if that might be a problem, and do experiments that could confirm this (for example, beefing up objects should diminish the performance difference against another collector). There are some cases when larger footprint means dropping out of CPU cache, look for L1/L2/LLC miss differences.
Many throughput differences can be explained by GC barriers overhead. When running with -XX:ShenandoahGCHeuristics=passive, and that heuristics only, barriers are not required for correctness, and so heuristics disables them. It is then possible to enable the barriers selectively back, and see what barriers are affecting throughput performance. The list of barriers that "passive" heuristics is disabling is listed in GC output, like this:
| Code Block | ||
|---|---|---|
| ||
$ java -XX:+UseShenandoahGC -XX:ShenandoahGCHeuristics=passive -Xlog:gc
[0.002s][info][gc] Passive heuristics implies -XX:-ShenandoahSATBBarrier by default
[0.002s][info][gc] Passive heuristics implies -XX:-ShenandoahKeepAliveBarrier by default
[0.002s][info][gc] Passive heuristics implies -XX:-ShenandoahWriteBarrier by default
[0.002s][info][gc] Passive heuristics implies -XX:-ShenandoahReadBarrier by default
[0.002s][info][gc] Passive heuristics implies -XX:-ShenandoahStoreValReadBarrier by default
[0.002s][info][gc] Passive heuristics implies -XX:-ShenandoahCASBarrier by default
[0.002s][info][gc] Passive heuristics implies -XX:-ShenandoahAcmpBarrier by default
[0.002s][info][gc] Passive heuristics implies -XX:-ShenandoahCloneBarrier by default
[0.003s][info][gc] Using Shenandoah |
--with-native-debug-symbols=internal, this will get you the mapping to C++ codeperf record java ... (plain profile) or perf record -g java ... (call tree profile)perf report"a" on the method usually gives a more detailed disassembly for itIt is important to understand that GC pauses might not be the only significant contributor to response times in regular applications. Having large GC pause spells the problem with response time with a very high probability, but the absence of long GC pauses does not always mean decent response time. Queueing delays, network latencies, other services latencies, OS scheduler jitter, etc. could be the contributing cost. Running Shenandoah with response time measurement is recommended to get the full picture of what is going on in the system, which can then be used to correlate with GC pause time statistics.
For example, this is a sample report with jHiccup on one of the workloads:
Functional Diagnostics
This section describes the ways one can diagnose and/or debug Shenandoah.
These are the steps you can do to narrow the problem area:
Run with -XX:+ShenandoahVerify. This is the first line of defense against GC bugs. It is available in both release and fastdebug builds. If Verifier identifies a problem, then it is most likely the GC bug. A simple reproducer would be convenient to have in order to diagnose this better. In many cases, what happened before in the GC matters, e.g. the last actions taken by GC. That history is usually recorded in associated hs_err_pidXXXX.log, be sure to include it in full while reporting the bug.Run with fastdebug build. In many cases, this will produce the meaningful assert messages, pointing at the earliest moment when GC detected the functional anomaly, and Shenandoah asserts a lot. These builds can be produced by adding --enable-debug to configure, and re-building. As usual, hs_err_pidXXXX.log conveniently records the environment and historical data that helps to investigate the assertion failure.
Run with -XX:ShenandoahGCHeuristics=passive, which will do the stop-the-world GCs only, and avoid doing most of concurrent work. If the issue goes away in passive mode, it must be the bug in concurrent phases and/or barriers.
Run with different compilers: -Xint (interpreter only), -XX:TieredStopAtLevel=1 (C1 only), -XX:-TieredCompilation (interpreter and C2 only) – to dissect which modes fail, and which are not. This would highlight if the issue is in barriers handling or optimizations in interpreter, C1, or C2. This is usually helpful to combine with fastdebug builds, because compilers assert things too.
Run with -XX:ShenandoahGCHeuristics=aggressive. This heuristics runs back-to-back GCs, and evacuates all non-empty regions. Since Shenandoah does most GC heavy-lifting concurrently, this does not block application from executing, although GC would consume much more cycles in this mode and slow the application down. Note that enabling Verifier in this mode would probably degrade performance to unpractical levels.
Add more verifications with -XX:+ShenandoahVerifyOptoBarriers (verifies barriers in C2's ideal graph), -XX:VerifyStrictOopOperations (performs additional checks to verify that oop comparisons are done correctly).
General debugging techniques apply to Shenandoah:
- Put logging statements in the code around the failing assert to understand the issue better. With enough logging, you can retrace everything that happened in the collector.
- Add more asserts around the suspicious parts in the code. Look at macro definitions in shenandoahAsserts.hpp to see what rich asserts are available
- Attach a native debugger, for example, gdb, by asking VM to do the external action on failure with -XX:OnError="gdb - %p" (%p would get substituted with process PID)
- Create a simple reproducer and hand it over to Shenandoah developers. :)
Build, Download, Install, and Run
Shenandoah is under development in mainline JDK since 12. Apart from mainline builds, there are downstream builds available for current JDKs. The changes flow between the development repos and builds as described on a simplified diagram below.
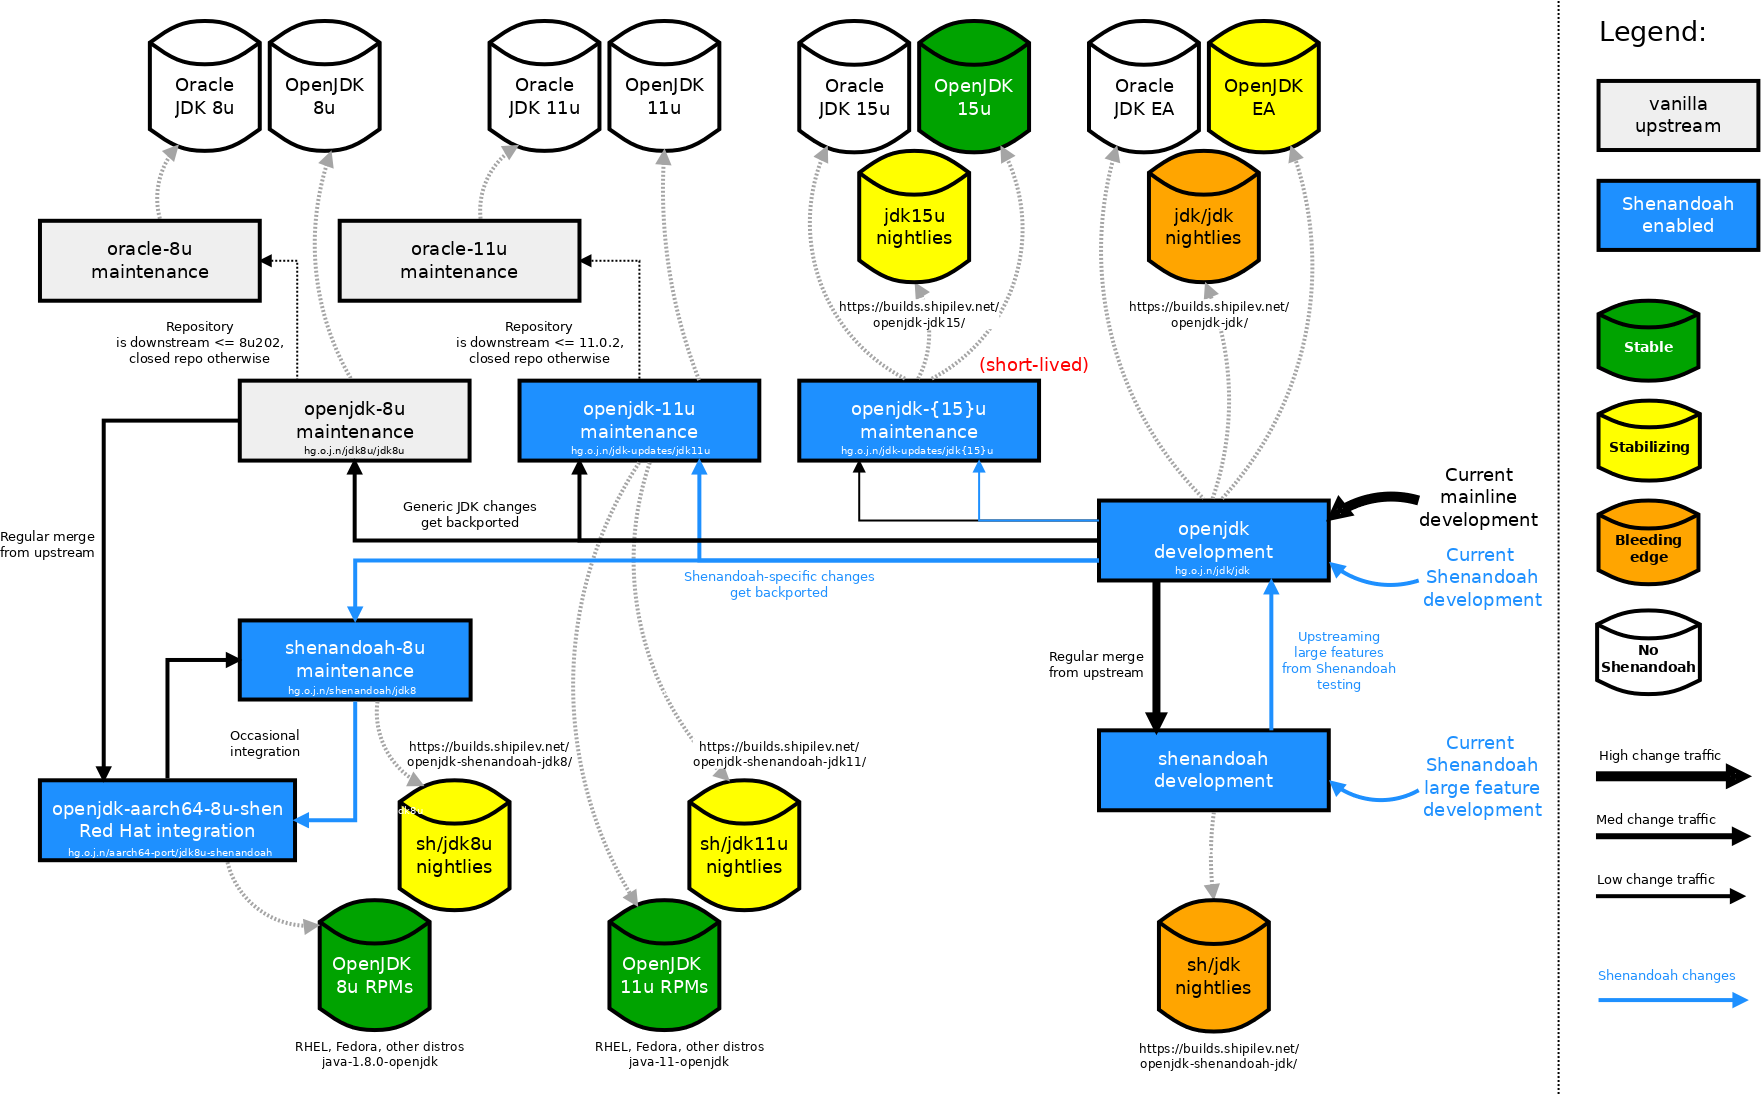
If you are an early adopter, trying bleeding edge builds should be more profitable performance-wise, but may risk exposure to not-yet-discovered bugs. If you are looking at running Shenandoah in the actual deployments, using the most stable builds is preferred. More detailed, there are different ways to get Shenandoah:
Releases
In many Linux distributions, Shenandoah is available within the OpenJDK binaries.
OpenJDK 12+ builds normally include Shenandoah by default; some vendors (notably Oracle) choose to exclude it
Fedora 24+ OpenJDK 8+ builds include Shenandoah
- RHEL 7.4+ ships with OpenJDK 8+ that includes Shenandoah as Technology Preview
- RHEL/Fedora-based distros or other distros that use packages from them may also have Shenandoah enabled. Notably, CentOS, Oracle Linux, and Amazon Linux are known to ship it.
- Gentoo ebuilds for IcedTea have Shenandoah USE flag
- Red Hat OpenJDK 8u builds for Windows include Shenandoah
Nightly Builds
There are (nightly/weekly) development builds available at these locations:
Linux/x86_64 nightly builds are also available as Docker images, e.g.:
| Code Block | ||
|---|---|---|
| ||
# Update the image to the most recent one:
$ docker pull shipilev/openjdk-shenandoah
$ docker pull shipilev/openjdk-shenandoah:11
$ docker pull shipilev/openjdk-shenandoah:8

# Run the latest version:
$ docker run --rm -it shipilev/openjdk-shenandoah java -XX:+UseShenandoahGC -Xlog:gc  -version
[0.007s][info][gc] Using Shenandoah
openjdk version "13-testing" 2019-09-17
OpenJDK Runtime Environment (build 13-testing+0-builds.shipilev.net-openjdk-shenandoah-jdk-b451-20190511-jdk-1318)
OpenJDK 64-Bit Server VM (build 13-testing+0-builds.shipilev.net-openjdk-shenandoah-jdk-b451-20190511-jdk-1318, mixed mode, sharing)
[0.041s][info][gc] Cancelling GC: Stopping VM

# JDK 11 backport:
$ docker run --rm -it shipilev/openjdk-shenandoah:11 java -XX:+UnlockExperimentalVMOptions -XX:+UseShenandoahGC -Xlog:gc  -version
[0.008s][info][gc] Using Shenandoah
openjdk version "11.0.4-testing" 2019-07-16
OpenJDK Runtime Environment (build 11.0.4-testing+0-builds.shipilev.net-openjdk-shenandoah-jdk11-b125-20190509-shenandoah-jdk-11.0.37)
OpenJDK 64-Bit Server VM (build 11.0.4-testing+0-builds.shipilev.net-openjdk-shenandoah-jdk11-b125-20190509-shenandoah-jdk-11.0.37, mixed mode)


# JDK 8 backport:
$ docker run --rm -it shipilev/openjdk-shenandoah:8 java -XX:+UnlockExperimentalVMOptions -XX:+UseShenandoahGC -verbose:gc -version
openjdk version "1.8.0-builds.shipilev.net-openjdk-shenandoah-jdk8"
OpenJDK Runtime Environment (build 1.8.0-builds.shipilev.net-openjdk-shenandoah-jdk8-b399-20190508-aarch64-jdk8u181-b15)
OpenJDK 64-Bit Server VM (build 25.71-b399-20190508-aarch64-jdk8u181-15, mixed mode)
|
Build From Source
This would guarantee you run the latest and greatest version. Some features and bugfixes may not be available in older JDK versions. Older JDK versions are supposed to be more stable.
Adding --enable-debug to ./configure would produce the "fastdebug" build that has more diagnostics.
You might find downloading the workspaces takes too long, especially for jdk10+ workspaces. In such case, you can download the workspace tarball from here: https://builds.shipilev.net/workspaces/
| Code Block | ||
|---|---|---|
| ||
# JDK master: $ hg clone http://hg.openjdk.java.net/shenandoahjdk/jdk shenandoah # JDK 1111u: $ hg clone http://hg.openjdk.java.net/shenandoahjdk-updates/jdk11jdk11u shenandoah # JDK 8u: $ hg clone http://hg.openjdk.java.net/shenandoah/jdk8 shenandoah $ cd shenandoah/ # Configure and build, JDK 11+: $ sh ./configure $ make images # Configure and build, JDK 8: $ sh ./get_source.sh $ sh ./configure $ make images # Run! JDK 11+: $ build/linux-x86_64-normal-server-release/images/jdk/bin/java -XX:+UseShenandoahGC -Xlog:gc [...][info][gc] Using Shenandoah # Run! JDK 8: $ build/linux-x86_64-normal-server-release/images/j2sdk-image/bin/java -XX:+UseShenandoahGC -version openjdk version "1.8.0-internal" OpenJDK Runtime Environment (build 1.8.0-internal-shade_2016_12_19_15_52-b00) OpenJDK 64-Bit Server VM (build 25.71-b00, mixed mode) |
Note: OpenJDK is normally compiled with all warnings treated as errors. Newer compilers may have more warnings that codebase had not yet caught up with. You can pass --disable-warnings-as-errors to ./configure in those cases.
In all cases for building from source it is optional, but advisable to run the tests. This is especially important on platforms beyond what Shenandoah currently targets, and/or building with too new or too old toolchains. You will need jtreg to run the tests, and it makes sense to run test against fastdebug build first:
| Code Block | ||
|---|---|---|
| ||
# Download and unpack jtreg from https://adopt-openjdk.ci.cloudbees.comadoptopenjdk.net/view/Dependencies/job/jtreg/lastSuccessfulBuild/artifact/ # Hook up jtreg to the build: $ sh ./configure --with-jtreg=<jtreg folder> --with-debug-level=fastdebug $ sh ./configure --with-jtreg=<jtreg folder> --with-debug-level=release # Run the tests: $ CONF=linux-x86_64-normal-server-fastdebug make images run-test TEST="tier3_gc_shenandoah" $ CONF=linux-x86_64-normal-server-release make images run-test TEST="tier3_gc_shenandoah" |
Resources
- Shenandoah Project
- Repositories
- Mailing list: shenandoah-dev
- Members
...
Overview
Content Tools