- Loading...
Page History
Shenandoah GC
Shenandoah is an ultra-low pause time garbage collector that reduces GC pause times by performing more garbage collection work concurrently with the running Java program. CMS and G1 both perform concurrent marking of live objects. Shenandoah adds concurrent compaction.
| Table of Contents | ||
|---|---|---|
|
Build and Run
Shenandoah is under development. There are several ways to try it:
Build the bleeding edge from the JDK 9 source. This would guarantee you run the latest and greatest version. Adding --enable-debug to configure would produce the "fastdebug" build.
Code Block language bash $ hg clone http://hg.openjdk.java.net/shenandoah/jdk9 shenandoah-jdk9 $ cd shenandoah-jdk9/ $ sh ./get_source.sh $ sh ./configure $ make images $ build/linux-x86_64-normal-server-release/images/jdk/bin/java -XX:+UseShenandoahGC -Xlog:gc [...][info][gc] Using Shenandoah
Build the JDK 8 backport: same as above, but change "jdk9" to "jdk8u" in the paths above. The advantage is that you don't need to figure out JDK 9 compatibility issues for your application first (although it is a good idea to try JDK 9 now anyway). The downside is, that forest may easily be several months behind the JDK 9 version. If you encounter trouble with JDK 8 version, please try JDK 9 version.
Code Block language bash $ hg clone http://hg.openjdk.java.net/shenandoah/jdk8u shenandoah-jdk8u $ cd shenandoah-jdk8u/ $ sh ./get_source.sh $ sh ./configure $ make images $ build/linux-x86_64-normal-server-release/j2sdk-image/bin/java -XX:+UseShenandoahGC -version openjdk version "1.8.0-internal" OpenJDK Runtime Environment (build 1.8.0-internal-shade_2016_12_19_15_52-b00) OpenJDK 64-Bit Server VM (build 25.71-b00, mixed mode)
Pick up the binary build from AdoptOpenJDK (jdk8, jdk9 – look at the publish dates, the builds might be outdated), or others (e.g. builds.shipilev.net).
- In some Linux distros, Shenandoah is available within the IcedTea binaries. The caveat is that those may lag behind the current development version even more.
Fedora 24/25:
Code Block language bash $ cat /etc/redhat-release Fedora release 25 (Twenty Five) $ java -XX:+UseShenandoahGC -version OpenJDK 64-Bit Server VM warning: Compressed Oops not supported with ShenandoahGC openjdk version "1.8.0_111" OpenJDK Runtime Environment (build 1.8.0_111-b16) OpenJDK 64-Bit Server VM (build 25.111-b16, mixed mode)
Gentoo ebuilds for IcedTea have Shenandoah USE flag.
Overview
Shenandoah is the regionalized collector, it maintains the heap as the collection of regions.
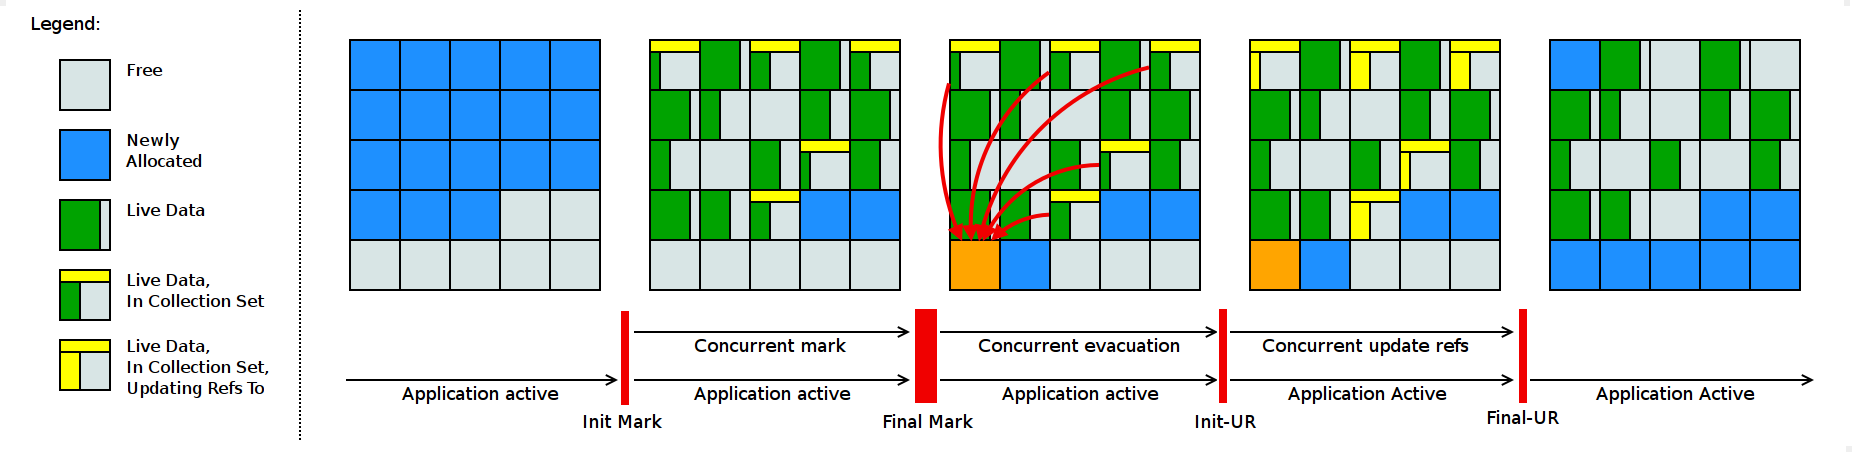
The regular Shenandoah GC cycle looks like this:
| Code Block | ||
|---|---|---|
| ||
GC(3) Pause Init Mark 1.142ms GC(3) Concurrent marking 7388M->7624M(8192M) 373.087ms GC(3) Pause Final Mark 7624M->2832M(8192M) 10.923ms GC(3) Concurrent evacuation 2836M->3224M(8192M) 115.076ms GC(3) Pause Init Update Refs 0.028ms GC(3) Concurrent update references 3224M->3424M(8192M) 210.427ms GC(3) Pause Final Update Refs 3424M->956M(8192M) 1.150ms GC(3) Concurrent reset bitmaps 956M->956M(8192M) 0.143ms |
The phases above do roughly this:
- Init Mark initiates the concurrent marking. It prepares the heap and application threads for concurrent mark, and then scans the root set. This is a pause, and the most dominant consumer is the root set scan.
- Concurrent Marking walks over the heap, and traces reachable objects. This phase is running alongside the application, and its duration is dependent on amount of live data in heap. Since the application is free to allocate new data during this phase, the heap occupancy goes up.
- Final Mark finishes the concurrent marking by draining all marking queues and re-scanning the root set. It also initializes evacuation by figuring out the regions to be evacuated (collection set), pre-evacuating some roots, and generally preparing application for the next phase. The most dominant time consumers here are draining the queues and scanning the root set. It also reclaims immediate garbage regions – that is, the regions where no live objects are present – this is why heap occupancy drops down at this phase.
- Concurrent Evacuation copies the objects out of collection set to other regions. This is the major difference against other OpenJDK GCs. This phase is again running along with application, and so application is free to allocate. Its duration is dependent on the size of chosen collection set for the cycle.
- Init Update Refs initializes the update references phase. It does almost nothing except making sure all GC and applications threads have finished evacuation, and then preparing GC for next phase.
- Concurrent Update References walks over the heap, and updates the references to objects that were moved during concurrent evacuation. Its duration is dependent on amount of data in heap.
- Final Update Refs finishes the update references phase by re-updating existing root set. It also recycles the regions from the collection set, because now they don't have any references left to them.
Heuristics tell when Shenandoah starts the GC cycle, and regions it marks for collection. Heuristics can be enabled with -XX:ShenandoahGCHeuristics=<name>. Some heuristics accept configuration parameters, which might help to tailor the GC operation to your use case better. Available heuristics include:
- passive. This heuristics tells GC to be completely passive. Once memory runs out, the Full STW GC would be triggered. This heuristics is used for functional testing, but sometimes it is useful for bisecting performance anomalies with GC barriers.
- aggressive. This heuristics tells GC to be completely active. It will start the new GC cycle as soon as previous one finishes, and it will evacuate all live objects. This heuristics is useful for functional testing. It incurs heavy performance penalty, because GC is actively stealing lots of CPU cycles from the application.
- dynamic. This heuristics decide to start GC cycle based on heap occupancy and allocation pressure. Useful tuning knobs for this heuristics are:
-XX:ShenandoahFreeThreshold=#: Set the percentage of free heap at which a GC cycle is started
-XX:ShenandoahAllocationThreshold=#: Set percentage of memory allocated since last GC cycle before a new GC cycle is started
- -XX:ShenandoahGarbageThreshold=#: Sets the percentage of garbage a region need to contain before it can be marked for collection
- adaptive (default). This heuristics observes the previous GC cycles, and tries to start the next GC cycle so that the free space available at all times was below the "free threshold". Useful tuning knobs are:
-XX:ShenandoahInitFreeThreshold=#: Initial remaining free threshold
-XX:ShenandoahMinFreeThreshold=#: Minimum remaining free threshold
-XX:ShenandoahMaxFreeThreshold=#: Maximum remaining free threshold
-XX:ShenandoahHappyCyclesThreshold=#: How many successful marking cycles before improving free threshold
-XX:ShenandoahGarbageThreshold=#: Sets the percentage of garbage a region need to contain before it can be marked for collection.
In some cycles, Update References phase is merged with Concurrent Marking phase, at heuristics discretion. You can forcefully enable/disable Update References with -XX:ShenandoahUpdateRefsEarly=[on|off].
Functional Diagnostics
This section describes the ways one can diagnose and/or debug Shenandoah.
Basic configuration and command line options:
- In many cases, running with fastdebug build will produce the meaningful assert messages, pointing at the earliest moment when GC detected the functional anomaly, and Shenandoah asserts a lot. These builds can be produced by adding --enable-debug to configure, and re-building.
- In many cases, running with -XX:ShenandoahGCHeuristics=aggressive is an efficient way to shake out GC bugs. This heuristics runs back-to-back GCs, and evacuates all non-empty regions. Since Shenandoah does most GC heavy-lifting concurrently, this does not block application from executing, although GC would consume much more cycles in this mode and slow the application down.
- It is possible to disable concurrent GCs with -XX:ShenandoahGCHeuristics=passive, which will do the stop-the-world mark-compact GCs only, and avoid doing most of concurrent work.
- Shenandoah supports several options that add even more verifications: -XX:+ShenandoahStoreCheck lets C2 compile machine code that checks that writes happen in tospace only. -XX:+ShenandoahVerify runs verification passes across the heap during collection. -XX:+ShenandoahVerifyOptoBarriers verifies barriers in C2's ideal graph. -XX:VerifyStrictOopOperations performs additional checks to verify that oop comparisons are done correctly (fastdebug only).
- If you suspect a JIT bug (and there are lots of Shenandoah-specific optimizations), it is a very good idea to try bisect which compiler failed by trying several VM modes: -Xint (interpreter only), -XX:TieredStopAtLevel=1 (C1 only), -XX:-TieredCompilation (interpreter and C2 only), default (interpreter, tiered C1, tiered C2).
Approaches for debugging:
- Put logging statements in the code around the failing assert to understand the issue better. With enough logging, you can retrace everything that happened in the collector.
- Attach a native debugger, for example, gdb, by asking VM to do the external action on failure with -XX:OnError="gdb - %p" (%p would get substituted with process PID)
- Create a simple reproducer and hand it over to Shenandoah developers. :)
Bug reports are welcome at the mailing list.
Performance Diagnostics
This section describes the approaches to test and diagnose performance behaviors with Shenandoah.
Basic configuration and command line options:
- Shenandoah performance, like the performance of almost all other GCs, depends on heap size. We expect it to perform better in cases when there is enough heap space to accommodate allocations while concurrent phases are running. The time for concurrent phases correlates with the live data set size (LDS) -- the space taken by live data. Therefore, the reasonable heap size is dependent on LDS in the workload: larger LDS-es require proportionally larger heap sizes. For some workloads with minuscule live data sets, 1...2 GB heaps performs well. We routinely test on 4...128 GB heaps on various workloads with up to 80% LDS size. Don't be shy to try different heap sizes to see what fits your workload.
- -Xlog:gc would print the individual GC timings. This is not specific to Shenandoah, most recent GCs with JDK 9 Unified Logging would work like that.
- -Xlog:gc+ergo would print the heuristics decisions, which might shed light on outliers, if any.
- -Xlog:gc+stats would print the summary table on Shenandoah internal timings at the end of the run. This summary table conveys important information about GC performance, and we would almost inevitably ask for one in a performance bug report. It is a good idea to always run with it enabled.
It is almost always a good idea to run with -Xlog:gc -Xlog:gc+ergo -Xlog:gc+stats for testing.
Approaches to performance analysis:
- Some odd performance behaviors – like the allocation failure GCs, or long final marks – can be explained by heuristics issues. If you have a long-running workload, running under ShenandoahVisualizer would let you understand the high-level GC behavior. Sometimes the odd behavior is clearly visible there.
- Some performance difference can be explained by larger allocation pressure under Shenandoah, since it includes the forwarding pointer with each object. Look at the allocation rates to see if that might be a problem, and do experiments that could confirm this (for example, beefing up objects should diminish the performance difference against another collector). There are some cases when larger footprint means dropping out of CPU cache, look for L1/L2/LLC miss differences.
- Many performance differences can be explained by GC barriers. Fortunately, when running with -XX:ShenandoahGCHeuristics=passive, barriers are not required for correctness, and so we can selectively disable them to see if that improves performance on a particular workload. The options are:
- -XX:-ShenandoahReadBarrier: disables read barriers
- -XX:-ShenandoahWriteBarrier: disables write barriers (pre-store SATB barriers, pre-store "to-space write" barriers, and any other write-related barriers)
- -XX:-ShenandoahAcmpBarrier: disables acmp ("==") barriers
- -XX:-ShenandoahCASBarrier: disables compareAnd{Set,Exchange} barriers
- -XX:-ShenandoahCloneBarrier: disables object/array clone barriers
- Profiling the native GC code is easy with Linux perf:
- Build OpenJDK with --with-native-debug-symbols=internal, this will get you the mapping to C++ code
- Run the workload with perf record java ... or perf record -g java ...
- Open the report with perf report
- Profiling the barriers code requires PrintAssembly-enabled build. We recommend to use JMH -prof perfasm to create the isolated scenarios and looking at the generated code under Shenandoah.
Resources
- Shenandoah Project
- Repositories
- Mailing list: shenandoah-dev
- Members
Shenandoah GC
Shenandoah is an ultra-low pause time garbage collector that reduces GC pause times by performing more garbage collection work concurrently with the running Java program. CMS and G1 both perform concurrent marking of live objects. Shenandoah adds concurrent compaction.
| Table of Contents | ||
|---|---|---|
|
Build and Run
Shenandoah is under development. There are several ways to try it:
Build the bleeding edge from the JDK 9 source. This would guarantee you run the latest and greatest version. Adding --enable-debug to configure would produce the "fastdebug" build.
| Code Block | ||
|---|---|---|
| ||
$ hg clone http://hg.openjdk.java.net/shenandoah/jdk9 shenandoah-jdk9
$ cd shenandoah-jdk9/
$ sh ./get_source.sh
$ sh ./configure
$ make images
$ build/linux-x86_64-normal-server-release/images/jdk/bin/java -XX:+UseShenandoahGC -Xlog:gc
[...][info][gc] Using Shenandoah
|
Build the JDK 8 backport: same as above, but change "jdk9" to "jdk8u" in the paths above. The advantage is that you don't need to figure out JDK 9 compatibility issues for your application first (although it is a good idea to try JDK 9 now anyway). The downside is, that forest may easily be several months behind the JDK 9 version. If you encounter trouble with JDK 8 version, please try JDK 9 version.
| Code Block | ||
|---|---|---|
| ||
$ hg clone http://hg.openjdk.java.net/shenandoah/jdk8u shenandoah-jdk8u
$ cd shenandoah-jdk8u/
$ sh ./get_source.sh
$ sh ./configure
$ make images
$ build/linux-x86_64-normal-server-release/j2sdk-image/bin/java -XX:+UseShenandoahGC -version
openjdk version "1.8.0-internal"
OpenJDK Runtime Environment (build 1.8.0-internal-shade_2016_12_19_15_52-b00)
OpenJDK 64-Bit Server VM (build 25.71-b00, mixed mode) |
Pick up the binary build from AdoptOpenJDK (jdk8, jdk9 – look at the publish dates, the builds might be outdated), or others (e.g. builds.shipilev.net).
Fedora 24/25:
Code Block language bash $ cat /etc/redhat-release Fedora release 25 (Twenty Five) $ java -XX:+UseShenandoahGC -version OpenJDK 64-Bit Server VM warning: Compressed Oops not supported with ShenandoahGC openjdk version "1.8.0_111" OpenJDK Runtime Environment (build 1.8.0_111-b16) OpenJDK 64-Bit Server VM (build 25.111-b16, mixed mode)Gentoo ebuilds for IcedTea have Shenandoah USE flag.
Overview
Shenandoah is the regionalized collector, it maintains the heap as the collection of regions.
The regular Shenandoah GC cycle looks like this:
| Code Block | ||
|---|---|---|
| ||
GC(3) Pause Init Mark 1.142ms
GC(3) Concurrent marking 7388M->7624M(8192M) 373.087ms
GC(3) Pause Final Mark 7624M->2832M(8192M) 10.923ms
GC(3) Concurrent evacuation  2836M->3224M(8192M) 115.076ms
GC(3) Pause Init Update Refs 0.028ms
GC(3) Concurrent update references  3224M->3424M(8192M) 210.427ms
GC(3) Pause Final Update Refs 3424M->956M(8192M) 1.150ms
GC(3) Concurrent reset bitmaps 956M->956M(8192M) 0.143ms |
The phases above do roughly this:
Init Mark initiates the concurrent marking. It prepares the heap and application threads for concurrent mark, and then scans the root set. This is a pause, and the most dominant consumer is the root set scan.Concurrent Marking walks over the heap, and traces reachable objects. This phase is running alongside the application, and its duration is dependent on amount of live data in heap. Since the application is free to allocate new data during this phase, the heap occupancy goes up.
Final Mark finishes the concurrent marking by draining all marking queues and re-scanning the root set. It also initializes evacuation by figuring out the regions to be evacuated (collection set), pre-evacuating some roots, and generally preparing application for the next phase. The most dominant time consumers here are draining the queues and scanning the root set. It also reclaims immediate garbage regions – that is, the regions where no live objects are present – this is why heap occupancy drops down at this phase.
Concurrent Evacuation copies the objects out of collection set to other regions. This is the major difference against other OpenJDK GCs. This phase is again running along with application, and so application is free to allocate. Its duration is dependent on the size of chosen collection set for the cycle.
Init Update Refs initializes the update references phase. It does almost nothing except making sure all GC and applications threads have finished evacuation, and then preparing GC for next phase.
Concurrent Update References walks over the heap, and updates the references to objects that were moved during concurrent evacuation. Its duration is dependent on amount of data in heap.
Heuristics tell when Shenandoah starts the GC cycle, and regions it marks for collection. Heuristics can be enabled with -XX:ShenandoahGCHeuristics=<name>. Some heuristics accept configuration parameters, which might help to tailor the GC operation to your use case better. Available heuristics include:
passive. This heuristics tells GC to be completely passive. Once memory runs out, the Full STW GC would be triggered. This heuristics is used for functional testing, but sometimes it is useful for bisecting performance anomalies with GC barriers.aggressive. This heuristics tells GC to be completely active. It will start the new GC cycle as soon as previous one finishes, and it will evacuate all live objects. This heuristics is useful for functional testing. It incurs heavy performance penalty, because GC is actively stealing lots of CPU cycles from the application.
dynamic. This heuristics decide to start GC cycle based on heap occupancy and allocation pressure. Useful tuning knobs for this heuristics are:
-XX:ShenandoahFreeThreshold=#: Set the percentage of free heap at which a GC cycle is started
-XX:ShenandoahAllocationThreshold=#: Set percentage of memory allocated since last GC cycle before a new GC cycle is started
-XX:ShenandoahInitFreeThreshold=#: Initial remaining free threshold
-XX:ShenandoahMinFreeThreshold=#: Minimum remaining free threshold
-XX:ShenandoahMaxFreeThreshold=#: Maximum remaining free threshold
-XX:ShenandoahHappyCyclesThreshold=#: How many successful marking cycles before improving free threshold
-XX:ShenandoahGarbageThreshold=#: Sets the percentage of garbage a region need to contain before it can be marked for collection.
In some cycles, Update References phase is merged with Concurrent Marking phase, at heuristics discretion. You can forcefully enable/disable Update References with -XX:
ShenandoahUpdateRefsEarlyFunctional Diagnostics
This section describes the ways one can diagnose and/or debug Shenandoah.
Basic configuration and command line options:
In many cases, running with fastdebug build will produce the meaningful assert messages, pointing at the earliest moment when GC detected the functional anomaly, and Shenandoah asserts a lot. These builds can be produced by adding --enable-debug to configure, and re-building.In many cases, running with -XX:ShenandoahGCHeuristics=aggressive is an efficient way to shake out GC bugs. This heuristics runs back-to-back GCs, and evacuates all non-empty regions. Since Shenandoah does most GC heavy-lifting concurrently, this does not block application from executing, although GC would consume much more cycles in this mode and slow the application down.
It is possible to disable concurrent GCs with -XX:ShenandoahGCHeuristics=passive, which will do the stop-the-world mark-compact GCs only, and avoid doing most of concurrent work.
Shenandoah supports several options that add even more verifications: -XX:+ShenandoahStoreCheck lets C2 compile machine code that checks that writes happen in tospace only. -XX:+ShenandoahVerify runs verification passes across the heap during collection. -XX:+ShenandoahVerifyOptoBarriers verifies barriers in C2's ideal graph. -XX:VerifyStrictOopOperations performs additional checks to verify that oop comparisons are done correctly (fastdebug only).
Approaches for debugging:
Put logging statements in the code around the failing assert to understand the issue better. With enough logging, you can retrace everything that happened in the collector.Attach a native debugger, for example, gdb, by asking VM to do the external action on failure with -XX:OnError="gdb - %p" (%p would get substituted with process PID)
Bug reports are welcome at the mailing list.
Performance Diagnostics
This section describes the approaches to test and diagnose performance behaviors with Shenandoah.
Basic configuration and command line options:
Shenandoah performance, like the performance of almost all other GCs, depends on heap size. We expect it to perform better in cases when there is enough heap space to accommodate allocations while concurrent phases are running. The time for concurrent phases correlates with the live data set size (LDS) -- the space taken by live data. Therefore, the reasonable heap size is dependent on LDS in the workload: larger LDS-es require proportionally larger heap sizes. For some workloads with minuscule live data sets, 1...2 GB heaps performs well. We routinely test on 4...128 GB heaps on various workloads with up to 80% LDS size. Don't be shy to try different heap sizes to see what fits your workload.-Xlog:gc would print the individual GC timings. This is not specific to Shenandoah, most recent GCs with JDK 9 Unified Logging would work like that.
-Xlog:gc+ergo would print the heuristics decisions, which might shed light on outliers, if any.
It is almost always a good idea to run with -Xlog:gc -Xlog:gc+ergo -Xlog:gc+stats for testing.
Approaches to performance analysis:
Some odd performance behaviors – like the allocation failure GCs, or long final marks – can be explained by heuristics issues. If you have a long-running workload, running under ShenandoahVisualizer would let you understand the high-level GC behavior. Sometimes the odd behavior is clearly visible there.Some performance difference can be explained by larger allocation pressure under Shenandoah, since it includes the forwarding pointer with each object. Look at the allocation rates to see if that might be a problem, and do experiments that could confirm this (for example, beefing up objects should diminish the performance difference against another collector). There are some cases when larger footprint means dropping out of CPU cache, look for L1/L2/LLC miss differences.
Many performance differences can be explained by GC barriers. Fortunately, when running with -XX:ShenandoahGCHeuristics=passive, barriers are not required for correctness, and so we can selectively disable them to see if that improves performance on a particular workload. The options are:
Profiling the native GC code is easy with Linux perf:
Profiling the barriers code requires PrintAssembly-enabled build. We recommend to use JMH -prof perfasm to create the isolated scenarios and looking at the generated code under Shenandoah.
Resources
- Shenandoah Project
- Repositories
- Mailing list: shenandoah-dev
- Members
Overview
Content Tools